BOP and BSP are two of the simplest strategies that we cover in our ebook Simple Trading Strategies That Work. Below is a table of the top 12 ETFs out of the 145 that we tested, using BOP over the last 9 months (189 trading days from May 1, 2011 to Jan 30, 2012).
| Ticker | BOP | Buy/Hold | ||
|---|---|---|---|---|
| 1 | SKF | 62.22 | -4.93 | |
| 2 | FAZ | 60.67 | -9.32 | |
| 3 | TUR | 52.84 | -20.89 | |
| 4 | TZA | 41.65 | -11.85 | |
| 5 | MDY | -41.23 | -12.55 | |
| 6 | EZA | 33.29 | -11.08 | |
| 7 | XME | -32.18 | -20.00 | |
| 8 | TWM | 31.03 | -7.01 | |
| 9 | UYG | 29.65 | -19.92 | |
| 10 | FXP | 28.75 | -1.54 | |
| 11 | EWY | 27.09 | -12.63 | |
| 12 | TNA | 26.10 | -36.47 |
The BSP strategy is the opposite of BOP, therefore a negative value in the BOP column indicates that BSP should be used to get a positive return. The columns labeled BOP and Buy/Hold are in units of profits per share in U.S. dollars. The Buy/Hold column shows profits if you would have just bought one share and held it over the 9 months, with negative values indicate a loss. The trading period is from close to close, with no transaction cost.
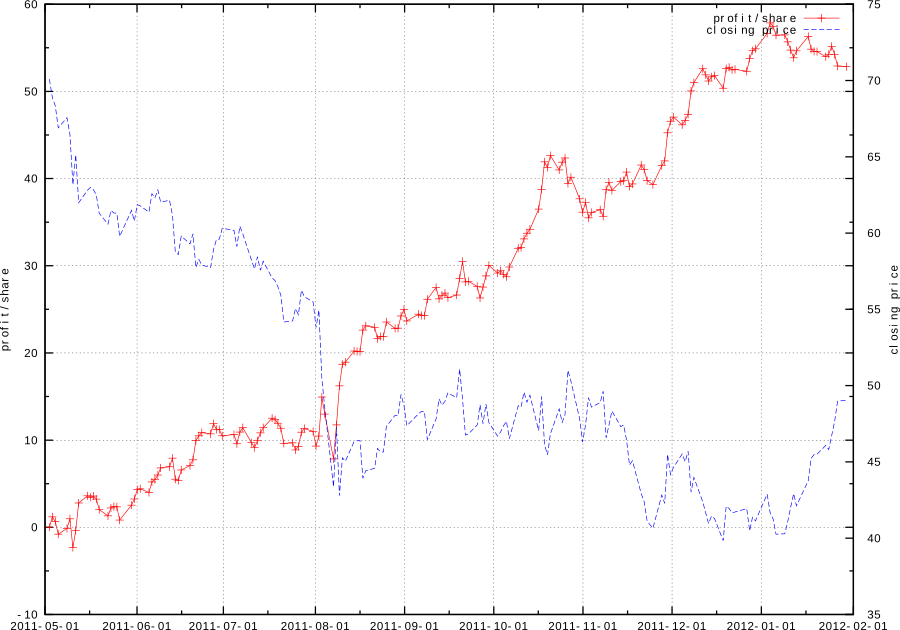
The impressive thing here is not just that we had some good profits with BOP/BSP, but that the signs are switched for most ETFs between the BOP and Buy/Hold columns. Take TUR for example. With the BOP strategy we would have made 52.84 per share, but with the dumb buy-and-hold strategy we would have lost 20.89 per share.
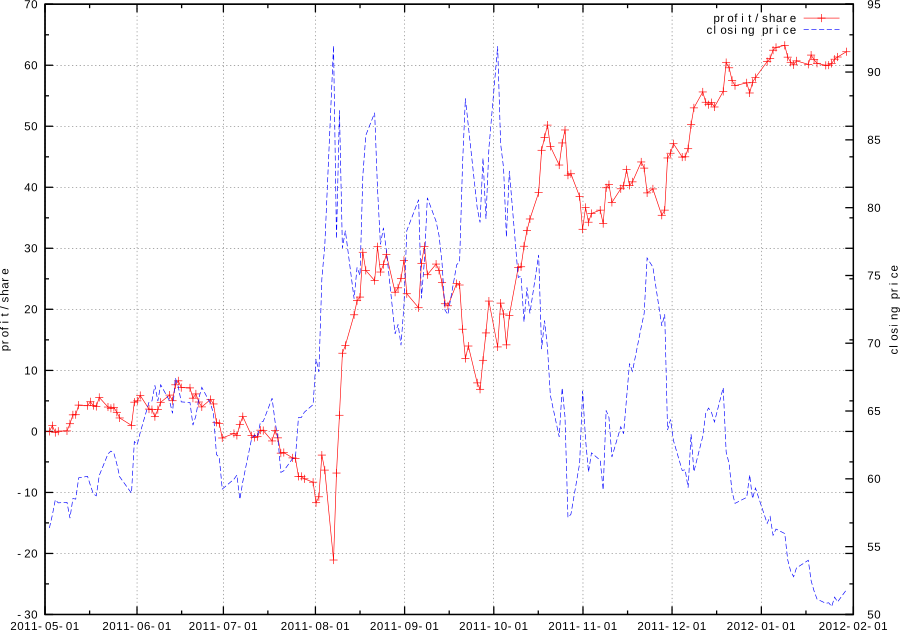
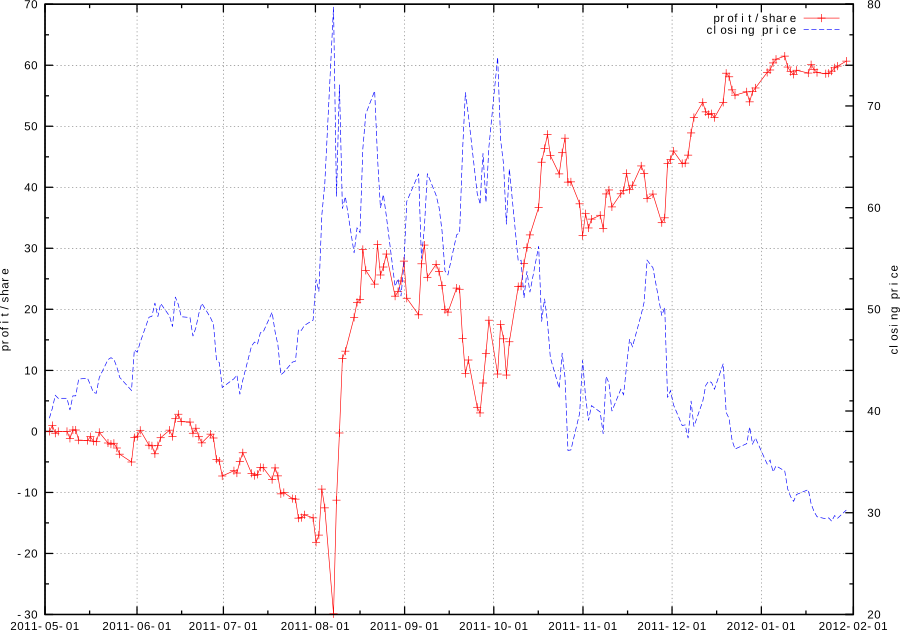
Below are plots of BOP profit per share (red) along with the closing price (blue) for the top 3 ETFs. Note that the first 2 plots are nearly identical because SKF and FAZ are very similar ETFs.

BOP strategy on SKF over last 6 months. Click for larger image.

BOP strategy on FAZ over last 6 months. Click for larger image.

BOP strategy on TUR over last 6 months. Click for larger image.
For more details on the BOP and BSP strategies, and for other more advanced strategies see our ebook Simple Trading Strategies That Work.
© 2010-2012 Stefan Hollos and Richard Hollos
blog comments powered by Disqus